Splunk is where most teams go when they stop storing logs and start asking questions about them. This is a practical guide to what Splunk does, where it fits, and what you need to figure out before you deploy it.
1. Tool Overview
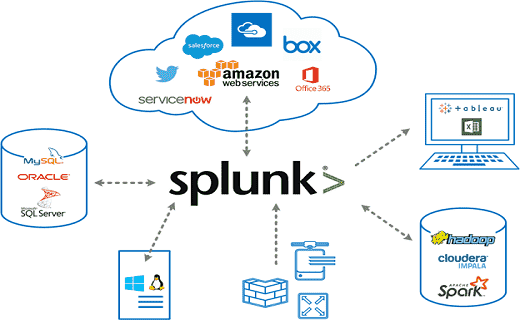
What does this tool do? Splunk is a SIEM (Security Information and Event Management) platform that collects indexes and analyzes machine-generated log data from across an IT environment in real time. Splunk acts as the central nervous system of a SOC — ingesting logs from endpoints, servers, firewalls, and cloud services, then allowing analysts to search, correlate, and visualize those events to detect threats, investigate incidents, and respond effectively.
What problem does it solve?
- Eliminates the need for manual, siloed log analysis across hundreds of systems
- Provides real-time visibility into security events happening across the entire environment
- Enables SOC analysts to detect threats (brute force, phishing, lateral movement) through correlation rules and SPL queries
- Reduces alert fatigue by filtering and enriching raw logs into meaningful, prioritized alerts
- Supports compliance mandates (PCI-DSS, HIPAA, SOX) by retaining and auditing security events
Where is it used in the cybersecurity lifecycle?
- Identify: Asset inventory, data source onboarding, understanding what logs exist
-
Detect: Real-time correlation, alert thresholds, anomaly detection via SPL queries
-
Respond: Incident investigation, timeline reconstruction, root cause analysis
- Recover: Forensic log review, gap identification, post-incident reporting
- Protect: Continuous monitoring dashboards, scheduled reports, threat intelligence enrichment
2. HOW THE TOOL WORKS
Working mechanism: Splunk works by collecting raw log data from any source, indexing it in time-stamped compressed buckets, and making it searchable via SPL (Search Processing Language). Unlike traditional databases, Splunk uses schema-on-read — meaning data is stored raw and structure is applied at query time. This allows Splunk to ingest any log format without pre-defining structure, making it extremely flexible for security environments.
Architecture components:
- Universal Forwarder: A lightweight agent (~4 MB) installed on endpoints. Collects and ships log to the indexer. Primary data collection method for endpoint log ingestion
- Indexer: The core engine. Receives raw data, parses it, and stores it in indexed buckets (hot warm cold frozen). All SPL searches query the indexer
- Search Head: The user-facing web interface (port 8000). Where analysts write SPL queries, build dashboards, set alerts, and view results
- Deployment Server: Centrally manages forwarder configuration across many endpoints
- Heavy Forwarder: A full Splunk instance used when pre-processing or routing data before it reaches the indexer
Data flow explanation: Log Source (endpoint, server, firewall, cloud) Universal Forwarder (ships raw logs) Indexer (parses, timestamps, indexes data) Search Head (analyst runs SPL query) Results displayed as table, chart, or alert.
Type:
-
Agent-based: Universal Forwarder installed on each endpoint — primary method for Windows endpoint log collection
-
Agentless: Syslog receiver (UDP/TCP port 514), HTTP Event Collector (HEC), or API-based log pull
- Signature-based correlation via SPL rules + optional ML-based anomaly detection (MLTK)
3. FEATURES & CAPABILITIES
Core Features:
- Understanding Splunk: Core concepts of indexing, source types, and the search pipeline
- Data Onboarding: Bringing in data from files, Windows Event Logs, syslog, and APIs
- Finding and Exploring Data: Using SPL to search, filter, and investigate events across all ingested logs
- Enrichment and Filtering: Adding context to raw logs using lookups, field extractions, and sourcetype normalization
- Sharing, Scheduling, and Alerts: Creating scheduled SPL searches, emailing reports, and triggering alerts on threshold conditions
- Visualization and Dashboards: Building security dashboards with charts, tables, and single-value panels
- Real-World Security Scenarios: Applying all skills to detect phishing attempts, brute force attacks, and suspicious network activity
Advanced Features:
- SPL (Search Processing Language): The core query language — stats, eval, rex, table, where, timechart, top, rare commands
- Field Extraction: Using the Interactive Field Extractor (IFX) or regex to pull custom fields from raw logs
- Lookup Tables: Enriching events with external data (IP reputation lists, user directories, asset inventories)
- Saved Searches: Storing frequently used SPL queries and scheduling them to run automatically
- Machine Learning Toolkit (MLTK): Anomaly detection and behavioral baselining on ingested data
- Splunk Apps: Installing add-ons from Splunkbase for specific data sources (Windows TA, Linux TA, Palo Alto TA, etc.)
Limitations:
- Free version capped at 500 MB/day — no alerting, no authentication, single-user only
- SPL has a steep learning curve for beginners with no prior query language experience
- Splunk Enterprise Security (ES) the full SIEM module — requires a separate, expensive license
- High infrastructure cost at scale; not cost-effective for small organizations
- Alert tuning requires significant time investment to reduce false positive noise
4. DEPLOYMENT MODELS
Supported environments:
- On-premises: Full deployment on local servers or bare metal — used for on- premises deployments
- Cloud: Deployed on AWS EC2, Azure VM, or GCP compute — suitable for cloud-based lab environments
- SaaS: Splunk Cloud Platform — fully managed by Splunk, no infrastructure management required
Deployment types:
- Single node: Indexer + Search Head on the same machine — suitable for lab and proof-of-concept use
- Distributed: Separate indexer(s), search head(s), and forwarders — required for production environments
- Agent-based: Universal Forwarder on each host — primary method for Windows endpoint log collection
- Agentless: Syslog, HEC (HTTP Event Collector), or scripted inputs — used for network devices and cloud APIs
5. SYSTEM REQUIREMENTS
OS: Windows 10 / 11 (64-bit) for home lab; Windows Server 2016 / 2019 / 2022 for production deployment
CPU: Minimum 4 cores (Intel Core i5 / AMD Ryzen 5 or better); 8+ cores recommended for smooth lab performance RAM: Minimum 8 GB RAM (as recommended for lab environments); 16 GB recommended for running Splunk + VM simultaneously on one machine Storage: Minimum 50 GB free disk space; SSD strongly recommended for fast index read/write performance Network requirements: Firewall / Windows Defender must allow inbound: port 8000 (Web UI), 9997 (forwarder-to-indexer), 8089 (REST API), 514 (syslog)
6. INSTALLATION & SETUP
A. Local Setup (MANDATORY)
Steps:
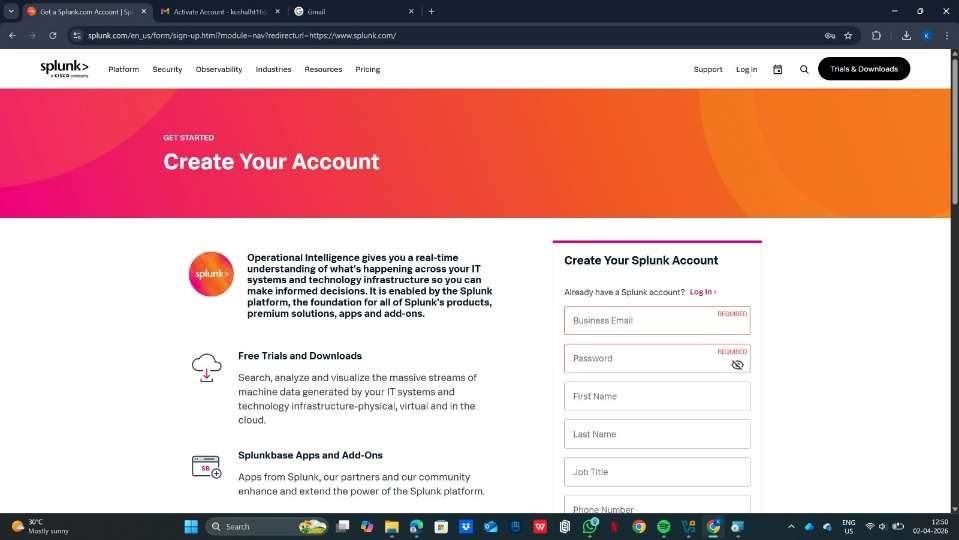
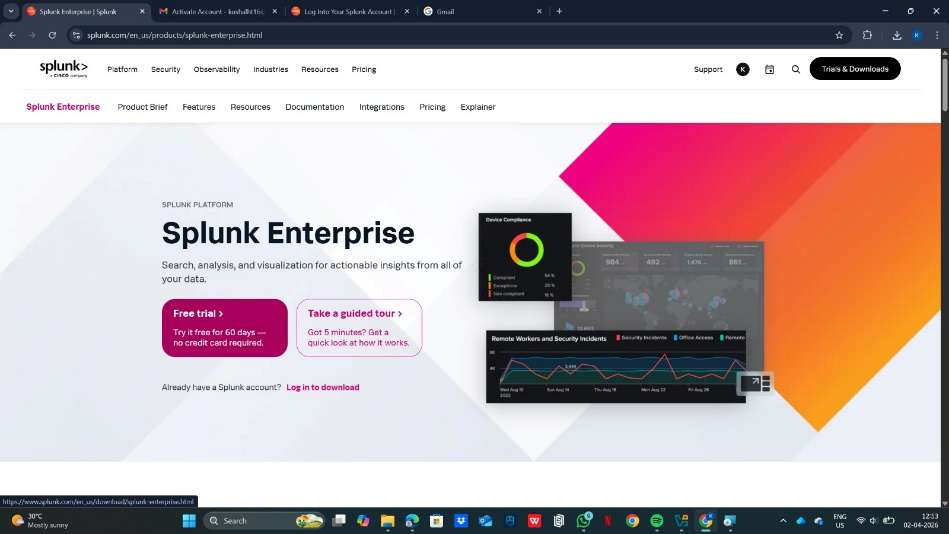
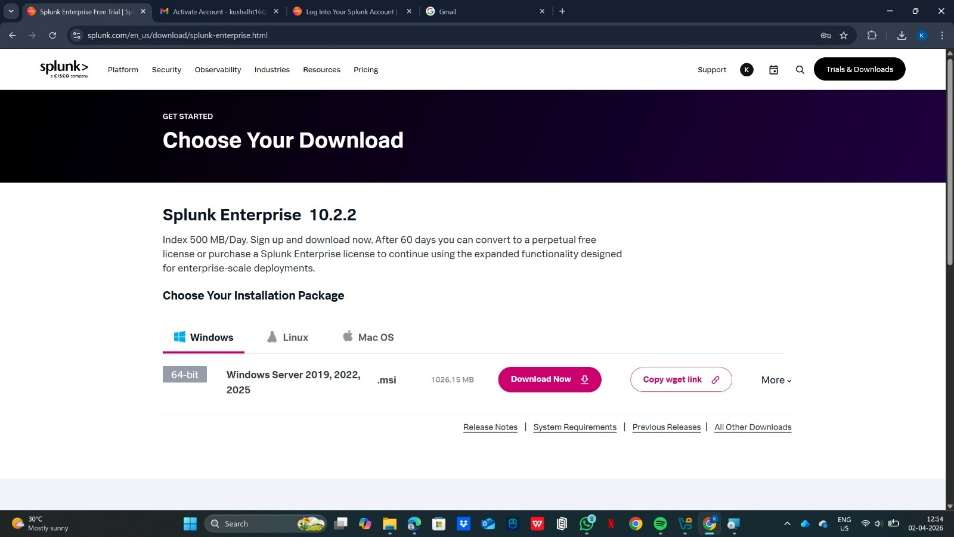
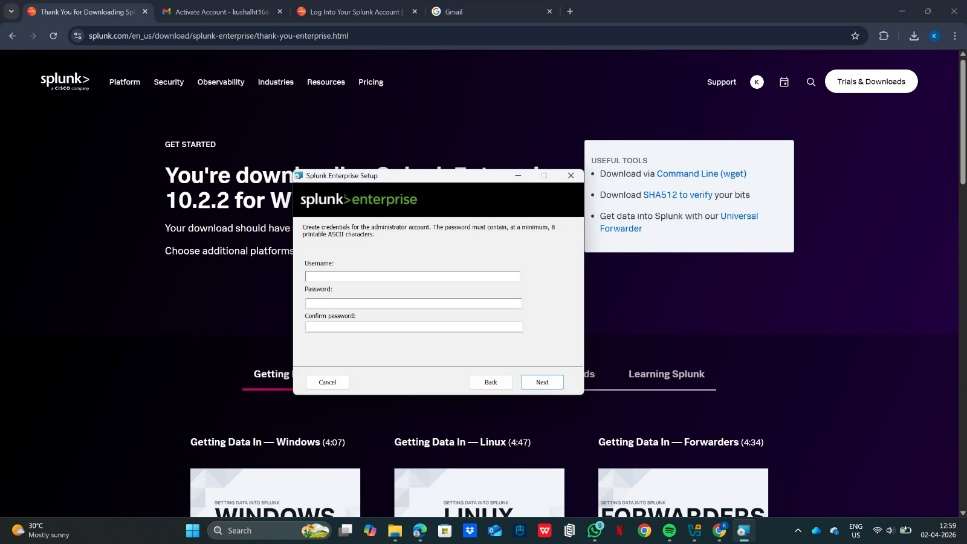
- Go to splunk.com/download and download the Splunk Enterprise Windows installer (.msi file)
- Run the installer as Administrator — double-click the .msi and follow the setup wizard
- Accept the license agreement and choose the installation directory (default: C:\Program Files\Splunk)
- Set an admin username and password when prompted during installation
- Splunk will automatically start as a Windows Service after installation is completed.
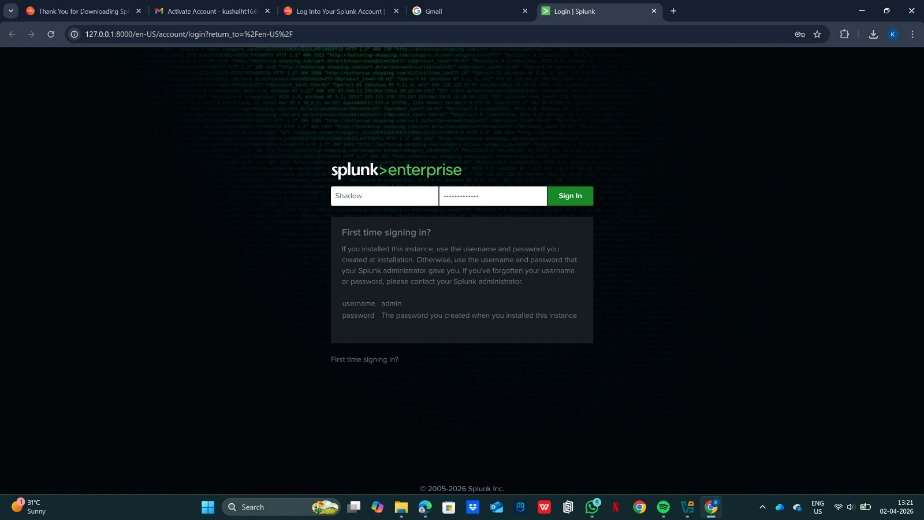
- Open your browser and go to http://localhost:8000 — log in with the admin credentials you set
- On a second machine (target/endpoint), download and install the Universal Forwarder .msi and point it to the Splunk server IP
B. Cloud Setup Cloud provider used: AWS EC2 with Windows Server 2019 AMI Instance type: t3.large (2 vCPU, 8 GB RAM) for lab; t3.xlarge (4 vCPU, 16 GB RAM) for heavier workloads
Setup steps:
- Launch EC2 instance using Windows Server 2019 Base AMI
- In Security Group, add inbound rules: TCP 8000 (Splunk Web), TCP 9997 (Forwarder), TCP 8089 (REST API), TCP 3389 (RDP for admin access)
- Connect to instance via RDP: download .rdp file from EC2 console, use admin password retrieved via key pair
- Once logged in, open browser on the Windows Server and download Splunk Enterprise .msi from splunk.com
- Run the .msi installer as Administrator and complete the setup wizard
- Access Splunk from your local machine at http://: Estimated daily cost: ~$0.09–$0.19/hr for t3.large/xlarge Windows instance = approximately $2–$5/day
7. CONFIGURATION
Basic Configuration:
- Settings > Data Inputs: Add file/directory monitors, Windows Event Log inputs, network ports (UDP/TCP), or HTTP Event Collector tokens
- Source Types: Assign correct sourcetype to each input so Splunk parses it correctly (e.g., WinEventLog:Security, WinEventLog:System, XmlWinEventLog)
- Index Management: Create separate indexes for different log categories (e.g., index=windows, index=network, index=web)
- User Management: Settings > Access Controls — create roles (admin, analyst, readonly) and assign Windows AD users
Example inputs.conf for Windows Event Log monitoring
[WinEventLog://Security] disabled = false index = windows sourcetype = WinEventLog:Security [WinEventLog://System] disabled = false index = windows sourcetype = WinEventLog:System [monitor://C:\inetpub\logs\LogFiles] disabled = false index = web sourcetype = iis
Advanced Configuration:
- props.conf: Define custom field extractions, timestamp formats, and multiline event handling per sourcetype
- transforms.conf: Lookup tables, field aliases, event routing, and sensitive data masking (e.g., masking passwords in logs)
- Field Extraction using IFX (Interactive Field Extractor): Point-and-click regex builder in the Splunk UI — built into the Splunk Web UI for analyst-friendly regex creation
-
Saved Searches: Save frequently used SPL queries as Knowledge Objects for team sharing
-
Lookup Tables: Upload CSV files (e.g., IP reputation, employee list) to enrich events with external context
Integrations:
- APIs: Splunk REST API (port 8089) for programmatic access to search, alerts, and configuration
- Third-party tools: ServiceNow (ticketing), Slack (alert notifications), PagerDuty (on-call escalation), VirusTotal (threat intel enrichment)
- Splunk Add-ons (TAs) from Splunkbase: Windows TA, Linux TA, Palo Alto TA, AWS TA — provide pre-built field extractions and CIM mapping for each data source
8. HANDS-ON USAGE (PRACTICAL)
Step-by-step workflow:
How to start tool:
From PowerShell (run as Administrator)
Start-Service Splunkd
Or from Command Prompt in Splunk bin directory
cd "C:\Program Files\Splunk\bin" splunk start Then open your browser and go to http://localhost:8000. Log in with admin credentials go to Search & Reporting app.
How to perform main function:
- Search for events: Type SPL query in the search bar select time range (Last 24 hours / All time) click Search
- Onboard new data: Settings Data Inputs Select input type Enter path or port Assign sourcetype and index
- Extract custom fields: Open an event click Event Actions Extract Fields use IFX to highlight field value Splunk generates regex automatically
- Create an alert: Run a search Save As Alert set condition (e.g., number of results > 5) choose action (email, webhook)
- Build a dashboard: Dashboards Create New Add Panel link each panel to a saved SPL search choose visualization type
Commands / UI actions (SPL examples):
Basic search — find all Windows Security events in last 24 hours
index=windows sourcetype=WinEventLog:Security | head 100
Find failed Windows login attempts (Event ID 4625)
index=windows sourcetype=WinEventLog:Security EventCode= | stats count by src_ip, user | sort -count
Detect brute force — more than 5 failed logins from same account
index=windows sourcetype=WinEventLog:Security EventCode= | stats count by Account_Name | where count > 5
Detect successful login after multiple failures (potential breach)
index=windows sourcetype=WinEventLog:Security (EventCode=4625 OR EventCode=4624) | stats count(eval(EventCode=4625)) as failures, count(eval(EventCode=4624)) as success by Account_Name | where failures > 5 AND success > 0
Top 10 accounts generating security events
index=windows sourcetype=WinEventLog:Security | top limit=10 Account_Name
Detect new user account creation (Event ID 4720)
index=windows sourcetype=WinEventLog:Security EventCode= | table _time, Account_Name, SubjectUserName, ComputerName
Time-chart of security events over time (for dashboard)
index=windows sourcetype=WinEventLog:Security | timechart count by EventCode
Use eval to flag high-risk event codes
index=windows sourcetype=WinEventLog:Security | eval risk=case(EventCode=4625,"Failed Login",EventCode=4720,"Account Created",EventCode=4732,"Group Modified",true(),"Other")
Output:
- Reports: Scheduled SPL searches that run on a cron schedule and can be emailed as PDF/CSV to stakeholders
- Alerts: Real-time notifications via email, Slack webhook, or SOAR trigger when a search condition is met
- Dashboard explanation: Collection of panels — each panel is a saved SPL search shown as a bar chart, pie chart, line graph, map, or single-value tile. Dashboards auto-refresh and give the SOC team a live view of the environment
9. LAB SETUP
Lab environment created:
- Host Machine: Windows 10 / 11 (64-bit), 16 GB RAM, 8-core CPU, 256 GB SSD — running VirtualBox or VMware Workstation
- Splunk Server VM: Windows Server 2019 (or Windows 10) — 8 GB RAM, 4 vCPU, 80 GB disk — Splunk Enterprise 9.x installed
- Target/Victim VM: Windows 10 — Universal Forwarder installed, forwarding Security, System, and Application Event Logs to Splunk
- Attacker VM: Kali Linux — used to simulate attacks against the Windows target (brute force, enumeration, port scanning)
Tools used:
- DVWA (Damn Vulnerable Web Application): Installed on Windows target VM using XAMPP; IIS/Apache access logs forwarded to Splunk for web attack detection
- Metasploitable 2 (optional secondary target): Used alongside the Windows VM to generate additional attack surface traffic
- Hydra (from Kali): Brute-force tool used to simulate RDP and SMB login attacks against the Windows target — generates Event ID 4625 (failed login) entries
- Nmap (from Kali): Network scanner simulating reconnaissance against the Windows VM — triggers Windows Firewall and network logs
- Splunk Universal Forwarder for Windows: Installed on the Windows target VM — ships Windows Event Logs (Security, System, Application) and IIS logs to Splunk
What was tested:
- Data onboarding: Successfully ingested Windows Security Event Log, System Event Log, Application Event Log, and IIS access logs
- SPL searching: Ran all query types including stats, eval, rex, top, timechart, table — against real Windows event data
- Field extraction: Used IFX to extract custom fields from IIS log lines (client IP, request URI, HTTP status code)
- Brute force detection: Simulated RDP brute force with Hydra; detected via Event ID 4625 correlation in Splunk SPL
-
Account creation monitoring: Tested alert for Event ID 4720 (new user account created) — triggered correctly
-
Privilege escalation detection: Monitored Event ID 4732 (user added to privileged group) and Event ID 4672 (special privileges assigned)
- Dashboard creation: Built a Windows SOC monitoring dashboard with panels for failed logins, new accounts, privilege changes, top source IPs, and event volume over time
Results:
- Splunk detected RDP brute force (Event ID 4625) within 30 seconds — alert triggered after 5 failed login attempts from Kali IP
- IFX successfully extracted cs-uri-stem, c-ip, and sc-status fields from raw IIS W3C log format
- Event ID 4720 (account creation) alert fired correctly within seconds of creating a test account on the Windows VM
- Windows Security Event Log dashboard showed real-time correlation of 4625, 4624, 4720, and 4732 events in separate panels
- IIS logs revealed GET requests with SQLi patterns (UNION SELECT) in the URI from DVWA testing — detected via rex extraction
- 500 MB/day free license limit reached after approximately 2–3 hours of full Windows Event Log ingestion from two VMs
10. USE CASE MAPPING
Target users: SOC Analysts (Tier 1 / Tier 2), Threat Hunters, Incident Responders, Security Engineers, Compliance Analysts Company size: Mid-market to large enterprise (500+ employees); SMBs may find cost a barrier Industry: Finance, Healthcare, Government, Telecom, Retail, Critical Infrastructure, Defense
Real-world scenarios (real-world scenarios):
- Use Case 1 — Brute Force Detection: Alert when any src_ip exceeds 5 failed login attempts within 5 minutes across SSH or web apps
- Use Case 2 — Phishing Detection: Correlate email gateway logs for suspicious attachment types and link clicks; flag accounts accessing known phishing URLs
-
Use Case 3 — Suspicious Network Activity: Detect port scanning (single src_ip contacting >50 unique dest_ports in 60 seconds)
-
Use Case 4 — Privilege Escalation: Alert on sudo or su command usage, especially outside business hours or by non-admin accounts
- Use Case 5 — Data Exfiltration: Detect abnormally high outbound data transfer to external IPs using network flow logs
- Use Case 6 — Web Application Attack: Identify SQLi or XSS patterns in HTTP request fields of Apache/Nginx access logs
- Use Case 7 — Insider Threat: Baseline normal user behavior and alert on deviations (off-hours access, unusual data downloads)
11. PRICING & SUBSCRIPTION MODEL
Pricing Type:
- Commercial with a Freemium entry point — Splunk Free allows 500 MB/day; paid tiers scale by daily ingestion volume (GB/day)
Plans Available:
- Free: 500 MB/day — no alerting, no authentication, single local user. Suitable only for learning and lab environments
- Splunk Enterprise (Paid): Unlimited ingestion up to licensed volume. Full alerting, RBAC, clustering, REST API, Splunk support
- Splunk Cloud Platform: SaaS — Splunk manages all infrastructure; priced per GB/day ingested or per workload credits consumed
- Splunk Enterprise Security (ES): The premium SIEM add-on — adds notable events, risk-based alerting, and MITRE ATT&CK coverage. Separately licensed on top of Enterprise or Cloud
- Splunk SOAR (formerly Phantom): Separate orchestration and automation platform — priced per automation action tier
Billing Model:
- Per GB/day indexed — primary licensing model for Splunk Enterprise (e.g., 10 GB/day license, 100 GB/day license)
-
Workload-based credits — available on Splunk Cloud (credits consumed by ingest, search, and storage workloads)
-
Term licenses — annual or multi-year contracts negotiated directly with Splunk/Cisco sales teams
Cost Estimation:
- Small company (up to 10 GB/day): Approximately $15,000 – $40,000 per year
- Medium company (10–100 GB/day): Approximately $75,000 – $300,000 per year
- Enterprise (100+ GB/day): $300,000 – several million per year depending on volume and add-ons
Hidden Costs:
- Infrastructure: Servers, NVMe SSD storage, networking — significant for on-premises deployments
- Add-ons: Splunk ES and SOAR are each separately licensed at substantial cost on top of base Splunk
- Maintenance: Dedicated Splunk admin role required in most organizations ($90k–$150k+ annually)
- Training: Splunk certifications (SPLK-1001, SPLK-2001, SPLK-3001) — $200–$300 per exam attempt; free resources are available at docs.splunk.com and Splunk's free training portal
12. FREE vs PAID COMPARISON
Key differences:
- Data ingestion limit: Free = 500 MB/day hard cap; Paid = licensed daily volume (no cap within license)
- Alerting: Not available in free version; full alert pipeline available in all paid tiers
- Authentication and RBAC: No login controls in free; full LDAP/SSO integration and RBAC in paid
- Multi-user support: Single user only (free); unlimited users with role-based access (paid)
- Clustering and HA: Single node only (free); full indexer and search head clustering in paid
-
REST API access: Limited in free; full REST API access is paid for integrations and automation
-
Support: Community forums only (free); SLA-backed Splunk technical support (paid)
Limitations of free version:
- No alerting means the free version cannot be used for any real security monitoring purpose
- No authentication — anyone who can reach port 8000 can access all data (not safe for production)
- 500 MB/day is exhausted within hours in any environment with more than a few systems logging
- Cannot integrate with LDAP, Active Directory, or SSO providers
When upgrade is required:
- Immediately, for any production or team environment — alerting alone requires a paid license
- When data volume from even a small lab (5+ machines fully logging) exceeds 500 MB/day
- When multiple team members need role-separated access to the same Splunk instance
- When compliance regulations mandate alerting, retention, and audit trails
13. COMPETITOR ANALYSIS
Competitor 1: Name: IBM QRadar SIEM
- Comparison: QRadar uses an Events Per Second (EPS) based licensing model vs Splunk's GB/day model — can be more predictable for environments with high event volume but small log sizes. QRadar has stronger out-of-the-box SIEM offense correlation rules and a more guided SOC workflow. Splunk is significantly more flexible — its SPL query language is far more powerful than QRadar's AQL, and Splunk's 2000+ add-on ecosystem dwarfs QRadar's ~500 DSMs. Splunk generally wins on data flexibility and analytics depth; QRadar wins on structured SOC workflows and offense management for traditional enterprise SOC teams
Competitor 2: Name: Microsoft Sentinel (Azure-native Cloud SIEM)
- Comparison: Sentinel is a cloud-native SaaS SIEM running on Azure — typically 40– 60% cheaper than Splunk at equivalent scale because it uses a pay-per-GB-analyzed model with no fixed license. Sentinel includes built-in UEBA (User and Entity Behavior Analytics), Fusion ML-based threat detection, and 300+ native connectors for Microsoft products (Azure AD, M365, Defender, Intune). It integrates far more seamlessly into Microsoft-centric environments. Splunk, however, supports broader non-Microsoft ecosystems, offers more powerful SPL vs Sentinel's KQL, and is equally strong in on-premises deployments. For cloud-first Azure shops, Sentinel is often cheaper and easier; for hybrid or multi-cloud environments, Splunk is usually the stronger choice
14. ADVANTAGES & DISADVANTAGES
Advantages:
- Ingests any data from any source without requiring predefined schemas — extreme flexibility
- SPL (Search Processing Language) is among the most powerful query languages of any SIEM platform
- Massive ecosystem of 2000+ Splunkbase add-ons for every major vendor and data source
- Scales from a single home lab VM (up to petabyte-scale enterprise
- Excellent community, documentation, and free learning resources (including official Splunk documentation and free community tutorials)
- Real-time detection with sub-minute alert latency when properly configured
- Proven at scale: trusted by 90 of the Fortune 100 companies globally
- Free trial (500 MB/day) allows analysts to learn and build skills without any financial investment
Disadvantages:
- Extremely expensive at scale — one of the highest total cost of ownership SIEMs on the market
- The free 500 MB/day limit is quickly exhausted, making real-world practice on the free tier challenging
-
SPL learning curve is steep for beginners — requires consistent practice (requiring consistent practice and hands-on lab work)
-
Splunk ES (the full SIEM capability) is a costly separate license — base Splunk alone is not a complete SIEM
- Acquired by Cisco in 2024 — long-term product direction and pricing strategy is currently uncertain
- Resource-hungry at scale — large deployments require dedicated infrastructure and administrators
15. ISSUES & TROUBLESHOOTING
Issues faced:
- Splunk Web UI not accessible at localhost:8000 after installation
- Universal Forwarder installed on endpoint but no data appearing in Splunk search results
- 500 MB/day free license limit reached — indexing paused, search still works but no new events ingested
- SPL search returning 0 results even though data should exist
- Field extraction (IFX) created but fields not appearing in search results
Errors:
- 'Connection refused' when accessing port 8000 — Splunk service not running
- 'Unable to distribute to peer' error — forwarder cannot reach indexer on port 9997
- 'License usage exceeds limit' warning banner in Splunk UI — daily cap hit
- 'Unknown search command' — SPL typo or unsupported command in current Splunk version
Fixes:
- UI not accessible: Run 'sudo /opt/splunk/bin/splunk status' to check if service is running; restart with 'splunk restart'
- Forwarder not sending: Check firewall rules on Splunk server (sudo ufw allow 9997); verify correct indexer IP in /opt/splunkforwarder/etc/system/local/outputs.conf
-
License violation: Reduce number of monitored log paths on forwarder; set maxTotalDataSizeMB in indexes.conf to cap individual index sizes
-
Zero results: Confirm the correct index name in your SPL (index=main vs index=linux_logs); check that data onboarding completed without errors in Settings > Data Inputs
- IFX fields missing: Ensure field extraction is saved to the correct sourcetype; run a search filtered to that sourcetype and check the Fields sidebar
Common mistakes:
- Using index=* in every search — always specify index= to improve search performance
- Not setting sourcetype during data onboarding — causes Splunk to use a generic parser and miss structured field extractions
- Forgetting to open port 9997 on the Splunk server firewall before testing forwarder connectivity
- Running Splunk as the root user instead of a dedicated splunk service account
- Building alerts without testing the underlying SPL first — always run and validate the search before saving as alert
16. SECURITY & COMPLIANCE
Data handling:
- All indexed data is stored locally in compressed, encrypted index buckets (AES- encryption available with Splunk SmartStore on S3)
- TLS 1.2/1.3 can be configured for all inter-component communication — forwarder to indexer, browser to web interface
- Sensitive data masking possible via transforms.conf — e.g., masking password values, credit card numbers, or SSNs in raw log events before indexing
- Role-based access control ensures analysts can only search indexes and data they are authorized to view
Log storage:
- Hot bucket: Currently being written — stored on fastest available storage (SSD/NVMe), typically last 0–24 hours
-
Warm bucket: Recently written, read-only — moved from hot when rolled, typically last 1–7 days
-
Cold bucket: Older data — can be moved to slower, cheaper storage; still fully searchable
- Frozen bucket: Oldest data — Splunk deletes by default or can be archived to S3/tape for long-term retention
Compliance support (if any):
- PCI-DSS: Splunk PCI Compliance app on Splunkbase provides pre-built dashboards and reports for PCI audit requirements
- HIPAA: Access logging, audit trails, field-level masking for PHI, and breach detection use cases
- SOX: Financial system change monitoring, privileged user access reviews, automated audit reports
- GDPR: Data residency controls when deployed in EU regions; retention policy enforcement via index lifecycle management
- NIST CSF and ISO 27001: Framework mapping available via Splunkbase compliance apps
- FedRAMP: Splunk Cloud Platform holds FedRAMP Authorization at the Government IL level
17. SCALABILITY & PERFORMANCE
Can it scale? Yes — Splunk is architected for horizontal scalability. Additional indexer nodes can be added to increase ingestion capacity linearly. Splunk SmartStore decouples compute from storage by offloading warm and cold buckets to S3-compatible object storage, enabling near-infinite log retention without proportional local storage costs.
Performance observations:
- Home lab (single node, 8 GB RAM): Handles approximately 500 MB – 2 GB/day comfortably for learning purposes
- Single production indexer (16+ GB RAM, SSD): Handles approximately 50–100 GB/day
- Clustered deployment (3–5 indexers): Scales to 500+ GB/day with high availability
-
SPL search performance is heavily affected by time range — always specify earliest= and latest= in queries
-
Tstats command (summary-based indexing) provides 10–100x faster search performance on large datasets vs regular SPL
Enterprise readiness:
- High Availability: Indexer cluster with replication factor of 3 eliminates single points of failure
- Disaster Recovery: Multi-site clustering with geographic replication across two or more data centers
- 99.9% uptime SLA provided on Splunk Cloud Platform managed service
- Trusted by 90 of the Fortune 100 companies in production environments — proven at petabyte scale
18. DEPLOYMENT SOP (COMPANY USE)
- Requirement Checklist
- Define daily log volume in GB/day and required retention period in months or years
- Identify and list all log sources: endpoints (Windows/Linux), network devices, cloud services, web apps
- Determine applicable compliance requirements (PCI, HIPAA, SOX, GDPR) that will drive retention and alerting rules
- Procure appropriate Splunk license tier — Enterprise for on-premises, Cloud for managed SaaS preference
- Identify integration points: ticketing (ServiceNow/Jira), notification (Slack/email), threat intel feeds
-
Architecture Selection
- Lab / Proof of Concept (<5 GB/day): Single node with Indexer + Search Head on same server
- Small Production (5–50 GB/day): Separate dedicated Indexer + Search Head + Deployment Server
- Medium Production (50–500 GB/day): 3-node Indexer Cluster + 3-node Search Head Cluster (SHC)
-
Large Enterprise (>500 GB/day): Multi-site cluster with SmartStore on S3 for cold/warm data
- Installation Steps
- Provision servers (on-prem or cloud) with Windows Server 2019 / 2022 or Windows 10/11 (64-bit)
- Install and configure Splunk Indexer(s) with dedicated SSD storage volumes
- Install and configure Search Head — connect to indexer cluster
- Deploy Deployment Server to centrally manage all Universal Forwarder configurations
- Roll out Universal Forwarders to all endpoints using deployment server app packages
- Install relevant Splunkbase Add-ons (TAs) on forwarders, indexers, and search head
- Configuration Steps
- Create named indexes in indexes.conf for each log category (e.g., index=windows, index=linux, index=network, index=cloud)
- Configure inputs.conf per forwarder group — specify source paths, sourcetypes, and target indexes
- Implement CIM normalization by installing and configuring vendor-specific TAs for all data sources
- Set up RBAC: Create roles for different analyst levels; integrate with LDAP/Active Directory
- Enable and verify TLS encryption on all inter-component communication channels
- Validation Checklist
- Confirm data flows from forwarder indexer searchable in Search Head within expected latency
- Run index=* | stats count by index, sourcetype to verify all expected sources are represented
- Test alert pipeline end-to-end: trigger condition confirm notification delivery (email/Slack)
- Validate RBAC: log in as each role and confirm appropriate access and restrictions
-
Establish performance baseline: document average search response time and indexing latency
-
Reporting Setup
- Build executive SOC dashboard: events/hour trend, top threat sources, alert volume by category
- Configure daily/weekly scheduled reports emailed to security leadership and compliance team
- Deploy security use case dashboards: brute force, privilege escalation, web attacks, data exfiltration
- Set up audit trail dashboard for privileged user activity and configuration changes
- Client Handover Process
- Deliver architecture diagram, data flow documentation, and index/sourcetype inventory
- Provide admin credentials in secure vault and operational runbook for common day-to-day tasks
- Conduct 2–4 hour hands-on admin training session covering search, alerts, and data onboarding
- Hand over full configuration backup of $SPLUNK_HOME/etc/ directory
- Document escalation path, SLA terms, and on-call contact matrix for ongoing support
19. DEMO SUMMARY
What was demonstrated:
- Lab setup: Installing Splunk Enterprise on a Windows Server 2019 VM and Universal Forwarder on a Windows 10 target VM
- Data onboarding: Successfully ingested Windows Security Event Log, System Event Log, Application Event Log, and IIS access logs from both VMs
- SPL query demonstration: Ran all major query types — stats, eval, rex, top, timechart, table — on real Windows event data
- Field extraction: Used IFX (Interactive Field Extractor) to extract c-ip, cs-uri-stem, and sc-status fields from raw IIS W3C log format
-
Brute force detection: Ran Hydra RDP brute force from Kali VM; detected in Splunk via Event ID 4625 correlation within 30 seconds
-
Alert setup: Created alert for more than 5 failed login attempts (Event ID 4625) from the same source in 5 minutes; confirmed email delivery
- Dashboard creation: Built a 5-panel Windows SOC monitoring dashboard covering failed login trend, top target accounts, privilege change events, new account creation alerts, and event volume by EventCode
Key findings:
- Splunk detected the Hydra RDP brute-force attack within 30 seconds — real-time detection confirmed via Event ID 4625 threshold alert
- Windows Event Logs are extremely rich in security data — Event IDs 4624, 4625, 4720, 4732, and 4672 alone cover the majority of SOC use cases
- IFX accurately extracted all targeted fields from raw IIS logs without needing to write any manual regex
- 500 MB/day free license exhausted in approximately 2 hours of full Windows Event Log ingestion — confirms that a paid license is necessary for any real environment
- Windows Security Event Log dashboard built in under 20 minutes using saved SPL searches — immediately usable for SOC monitoring
Demo video