1. Tool overview
What does this tool do?
Palo Alto Networks provides a comprehensive cybersecurity platform designed to protect an organization’s digital infrastructure. Its tools monitor network traffic, secure cloud environments, and safeguard endpoints. By combining multiple security capabilities into one ecosystem, it helps maintain a strong security posture against cyber threats.
What problem does it solve?
Modern organizations face threats such as ransomware, phishing attacks, and data breaches. Palo Alto Networks addresses these challenges by:
- Preventing unauthorized access to systems
- Detecting and blocking malware and advanced threats
- Providing visibility across network, cloud, and user activity
- Reducing the workload on security teams through automation
Overall, it helps organizations strengthen their security posture while simplifying security management.
Where is it used in the cybersecurity lifecycle?
Palo Alto Networks plays a role across the cybersecurity lifecycle:
- Identify: Discovers assets and monitors cloud environments
- Protect: Enforces security policies using firewalls and access controls
- Detect: Identifies threats using analytics and machine learning
- Respond: Automates incident response and mitigation
- Recover: Supports analysis, reporting, and system recovery
This makes it a complete end-to-end security solution.
2. How the tool works (technical)
Working mechanism
Palo Alto Networks uses a Next-Generation Firewall (NGFW) combined with cloud-based intelligence and AI. It inspects network traffic in real time using techniques such as Deep Packet Inspection (DPI), which identifies applications, users, and content within traffic and evaluates them against security policies and behavioral detections.
If suspicious files or activities are detected, they can be sent to a cloud-based sandbox for deeper analysis. Based on the results, the system allows or blocks the activity as part of threat prevention.
Architecture components
The platform includes key layers:
- Network security layer: Next-Generation Firewalls and centralized management tools to control and monitor network traffic
- Cloud security layer: Visibility and protection for cloud environments using API-based integrations
- Detection & response layer: AI-powered tools that detect threats, correlate events, and automate responses
These components work together as a unified and scalable security architecture.
Data flow (high level)
- A user or device sends traffic through the network
- The firewall intercepts and inspects the traffic
- The system identifies the application, user, and content
- Traffic is checked against security policies and threat intelligence
- Suspicious files are sent to a sandbox environment for analysis
- Based on results, traffic is allowed or blocked
- Logs and alerts are generated and forwarded for monitoring and response
Tool type
Palo Alto Networks uses a combination of approaches depending on the product:
- Agent-based: installed on endpoints for monitoring and protection
- Agentless: uses APIs to scan cloud environments without installing software
3. Features & capabilities
Core features
- Next-Generation Firewall (NGFW): Deep visibility into network traffic and access control based on applications and users (not only IP addresses)
- Threat prevention: Detects and blocks malware, ransomware, and known exploits using signatures and real-time threat intelligence
- Application awareness (App-ID): Identifies and controls applications regardless of port or protocol
- User identification (User-ID): Links network activity to specific users, enabling user-based security policies
- Content inspection (Content-ID): Scans files and data for malicious content, preventing breaches and malware delivery
- Centralized management: Manage policies, monitor traffic, and analyze logs from a single interface
Advanced features
- AI/ML-based threat detection: Identifies unknown and zero-day threats based on behavior and anomalies
- WildFire sandbox analysis: Analyzes suspicious files in a secure cloud environment to identify unknown malware
- Extended detection and response (XDR): Correlates data across endpoints, networks, and cloud environments for improved detection
- Security orchestration, automation, and response (SOAR): Automates incident response, reducing time and manual effort
- Threat intelligence integration: Continuously updates detections with new threat data to improve accuracy
4. Deployment models
Supported environments
- On-premise: Deploy within your infrastructure using hardware appliances and on-prem management (common when you need full control over systems and data).
- Cloud: Supports major cloud providers like AWS, Microsoft Azure, and Google Cloud. Cloud products (e.g., Prisma Cloud) integrate via APIs for posture management and protection.
- SaaS: Many Palo Alto services are delivered as SaaS and managed by Palo Alto Networks, reducing local infrastructure needs.
Deployment types
- Single node: One firewall or instance handles traffic and security policies (often used in smaller environments).
- Distributed: Multiple interconnected components (firewalls, cloud services, endpoints) working together across regions or business units.
5. System requirements
Requirements vary by product and deployment (NGFW appliances vs Prisma/Cortex services vs endpoint agents). The below is a practical baseline.
OS / platform
- Appliances: Linux-based (vendor-managed)
- Console (common options): Ubuntu, CentOS, Red Hat
- Defender/agents: Linux / Windows (Kubernetes environments supported depending on the product)
- Endpoints (agent-based tools): Windows, Linux, macOS
Compute (example baseline)
- CPU: minimum 2 vCPU
- RAM: minimum 4 GB (recommended 8–16 GB)
- Storage: minimum 50 GB (recommended 100 GB+ for logs & reports)
6. INSTALLATION
The are some steps for the installing or accessing the prisma cloud in PaloAltoNetworks :
Step 1: Tenant Provisioning
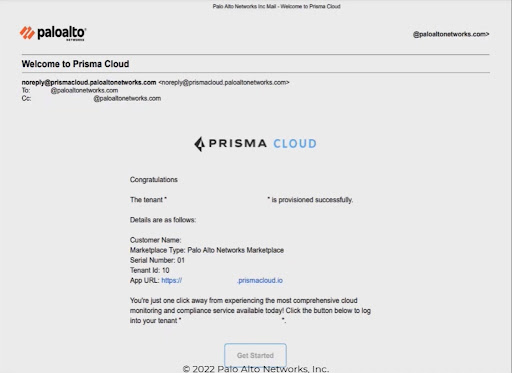
Before logging in, ensure you have received your provisioning email.
- Locate the Welcome Email: Look for an email with the subject "Welcome to Prisma Cloud" from noreply@prismacloud.paloaltonetworks.com.
- Verify Details: Note your Tenant ID and the App URL provided in the email.
- Access the Platform: Click the "Get Started" button at the bottom of the email to be redirected to the login page.
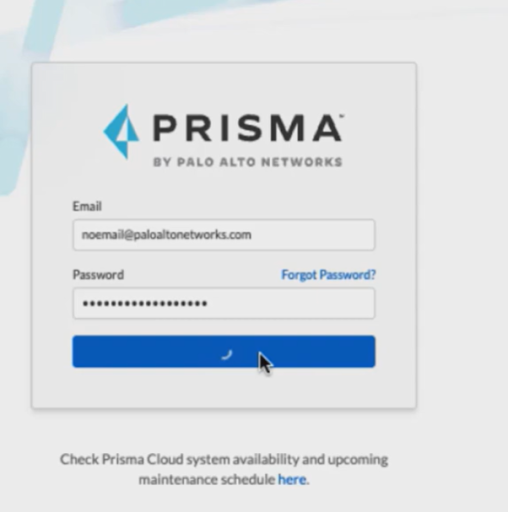
Step 2: Logging In
- Enter Credentials: On the Prisma login screen, enter your registered email address (e.g., your corporate email) and your password.
- System Check: If you encounter issues, you can click the "here" link at the bottom of the login box to check the system availability and maintenance schedule.
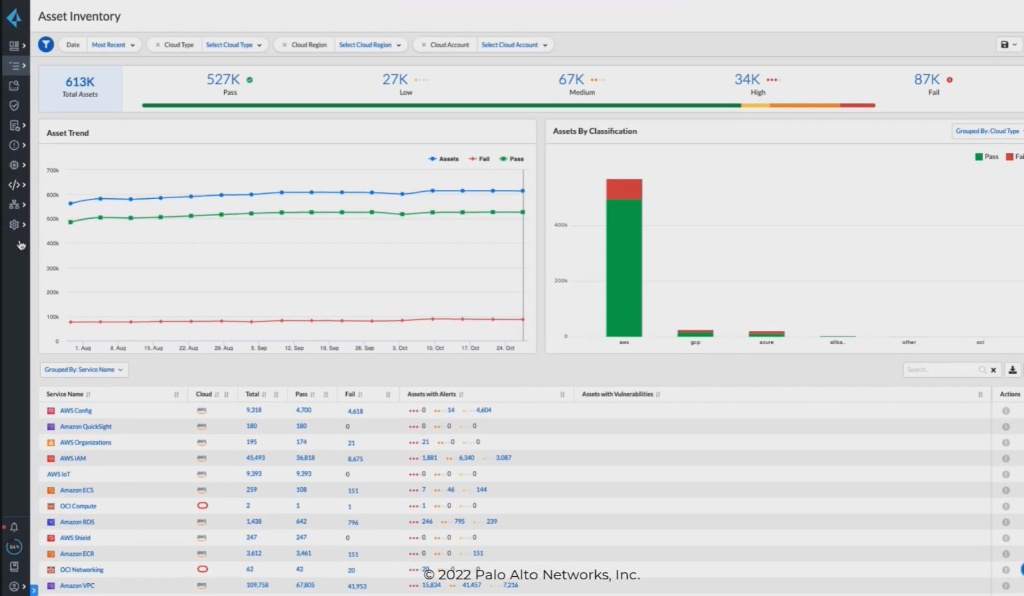
Step 3: Navigating the Dashboard
Once logged in, you will land on the Asset Inventory page, which provides a high-level overview of your cloud environment:
- Total Assets: View the total count of assets across all connected clouds (e.g., 613K).
- Security Posture: Monitor the status of assets categorized by Pass, Low, Medium, High, and Fail.
- Trend Analysis: Use the Asset Trend graph to see how your asset count and security failures change over time.
- Classification: The bar chart shows assets grouped by provider (AWS, GCP, Azure, etc.).
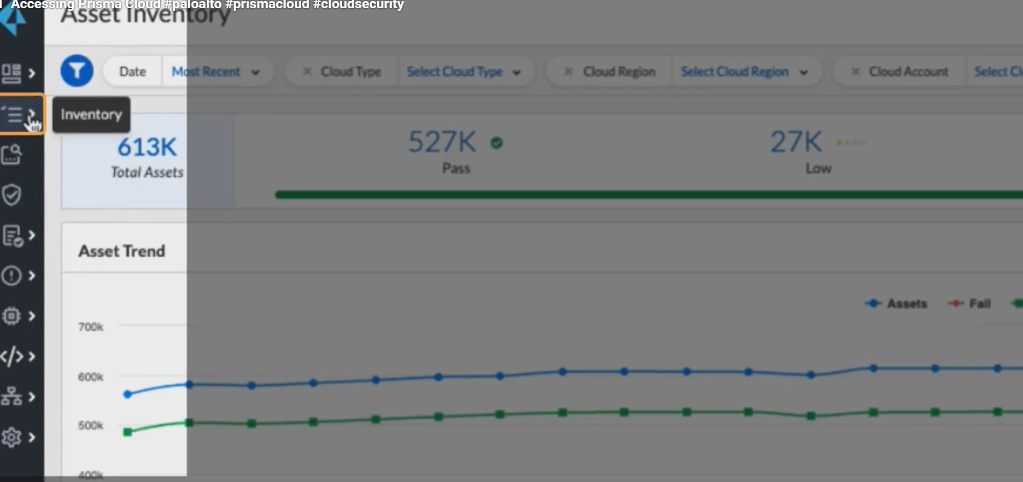
Step 4: Managing Inventory
- Side Menu: Use the icons on the left-hand sidebar to switch between modules. Hovering over the list icon (second from top) opens the Inventory menu.
- Service List: Scroll down to see specific services (e.g., AWS Config, IAM, Amazon RDS). You can see exactly how many assets are "Passing" or "Failing" per service.
- Filters: Use the top ribbons to filter by Cloud Type, Cloud Region, or specific Cloud Accounts.
Step 5: Onboarding Cloud Accounts
If you need to connect a new cloud environment (AWS, Azure, or GCP):
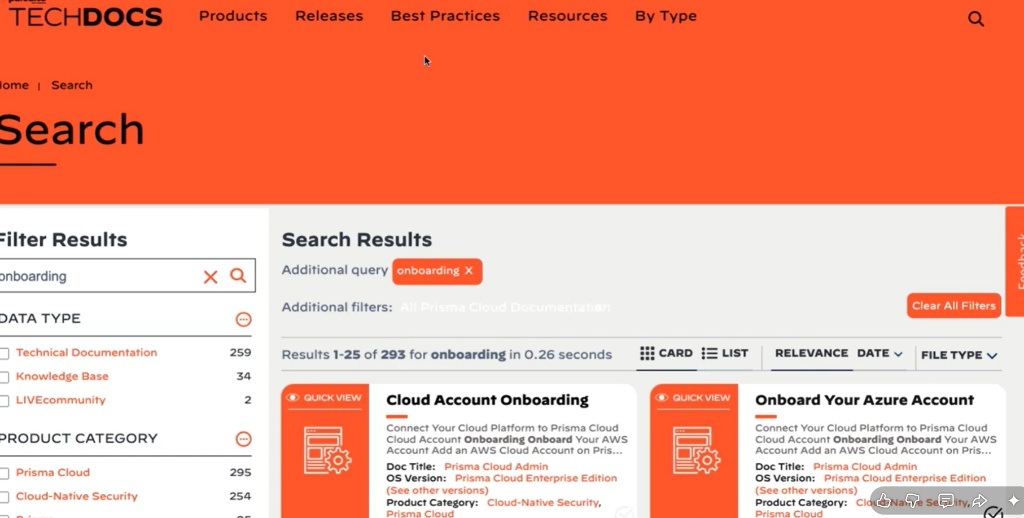
- Navigate to the Palo Alto TechDocs site (as shown in your search screenshots).
- Search for "Onboarding".
- Select the specific guide for your provider (e.g., "Onboard Your Azure Account" or "Cloud Account Onboarding" for AWS).
- Follow the specific API or Terraform-based steps provided in the documentation to grant Prisma Cloud read-only or remediate access to your cloud metadata.
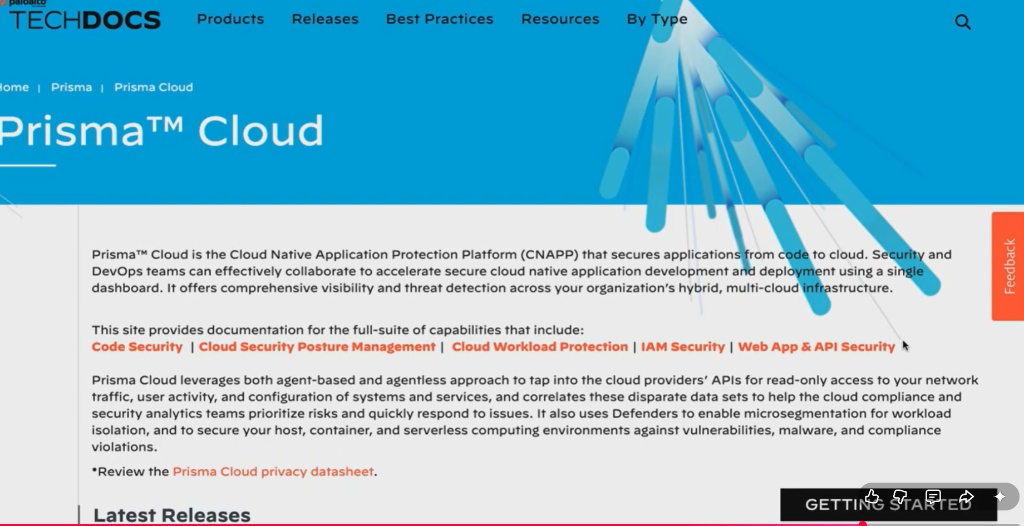
Step 6: Accessing Support & Documentation
- TechDocs: Visit the Prisma Cloud TechDocs page for the full suite of capabilities, including IAM Security and Web App & API Security.
- Search Filters: Use the sidebar on the TechDocs page to filter results by Product Category (e.g., Prisma Cloud Enterprise Edition) to ensure you are reading the correct instructions for your version.
7. CONFIGURATION
Basic Configuration:
- Initial step is to setup and install the tool.
- After create a user account and add login credentials
- Set as default preferences in settings. (language, theme, notifications)
- This is basic input/output settings
ii) Advanced Configuration:
- Customization of workflows and automation rules
- Role-based access control and permissions
- Performance tuning and optimization settings
- Data storage, backup, and security configurations
Integrations:
i) APIs:
- REST API integration used for data exchange.
- They use authentication methods like (API keys, OAuth).
- The webhooks for real-time updates
ii) Third-party tools:
- It uses integration with external software (e.g., databases, analytics tools)
- They also use the cloud services (Google Drive, AWS, etc.).
- It includes some collaboration tools (like Slack, Teams, etc.)
8. HANDS ON USAGE
To start a tool there are some steps need to follow;
- Start Console
- Option: Docker (Lab setup)
Username: admin
Password: (set during first login)
2. How to Perform Main Function
Step 1: Deploy Defender Docker Defender
This connects Defender → Console
Step 2: Scan Images / Hosts
UI Steps:
- Go to Monitor → Vulnerabilities
- Select, Images, Hosts, Containers
Prisma scans for CVEs (security vulnerabilities) and Misconfigurations
Step 3: Configure Policies
- Go to Defend → Vulnerabilities → Images/Hosts
- Create rules:
- Block critical CVEs
- Alert on high-risk images
Step 4: Enable Runtime Protection
Go to: - Defend → Runtime → Containers
Enable: - Process monitoring
10. USE CASE MAPPING – Prisma Cloud
Target Users:
- Cloud Security Engineers → Manage cloud security posture
- DevOps / Dev SecOps Teams → Secure CI/CD pipelines
- SOC Analysts → Monitor threats and alerts
- IT Administrators → Manage infrastructure security
- Compliance Officers → Ensure regulatory compliance
Company Size:
- Medium Enterprises
- Multi-cloud environments
- Growing DevOps teams
- Large Enterprises
- Complex cloud infrastructure
- Need centralized security
- Startups (Cloud-native)
- Security automation from early stage
Industry:
Prisma Cloud is widely used in:
- Banking & Financial Services
- Protect sensitive financial data
- Healthcare
- Secure patient data (HIPAA compliance)
- E-commerce
- Protect payment systems & customer data
- IT & SaaS Companies
- Secure applications & cloud workloads
- Government & Defense
- High-security environments
Real-World Scenarios:
1. Misconfigured Cloud Storage (CSPM Use Case)
- Problem: Public S3 bucket exposing data
- Solution:
- Prisma Cloud detects misconfiguration
- Sends alert
- Result: Data breach prevented
11. PRICING & SUBSCRIPTION MODEL
Pricing Type:
- Subscription-based
- Its license tied to usage of some we (cloud assets/workloads)
- SaaS pricing managed by Palo Alto Networks
Plans Available:
There are two plans available:
Free:
- No permanent free version
- Free Trial (limited days) available
- Full feature access
- Used for evaluation
Paid:
Prisma Cloud offers modular pricing:
- CSPM (Cloud Security Posture Management)
- CWPP (Compute / Defender)
- CIEM (Identity security)
.FREE vs PAID COMPARISON
Key Differences:
The key differences are:
| Feature | Free Trial | Paid Version |
|---|---|---|
| Access Duration | Limited (trial period) | Ongoing subscription |
| Features | Full features (temporary) | Full features (permanent) |
| Cloud Integration | Limited testing use | Full production use |
| Support | Basic / limited | Enterprise-grade support |
| Scalability | Limited assets | Unlimited (based on plan) |
| Compliance Reports | Available (trial only) | Continuous monitoring |
These are the key differences in the Free vs Paid.
ADVANTAGES AND DISADVANTAGES
There are some list of advantages and disadvantages:
Advantages:
- Comprehensive Cloud Security Platform
Provides end-to-end security across: - Cloud infrastructure (CSPM)
- Workloads (CWPP)
-
Identity (CIEM)
Single platform reduces need for multiple tools -
Agentless + Agent-based Security
- CSPM works without agents → easy deployment
-
Defender provides deep runtime protection
-
Multi-Cloud Support
Supports: - AWS
- Azure
-
GCP
Centralized dashboard for all environments -
Real-Time Monitoring & Alerts
Detects: - Misconfigurations
- Vulnerabilities
-
Runtime attacks
Provides instant alerts and logs -
Strong Compliance Capabilities
Built-in standards: - CIS
- PCI-DSS
-
HIPAA
Generates audit-ready reports -
Dev SecOps Integration
- Integrates with CI/CD pipelines
-
Helps detect vulnerabilities before deployment
-
Scalable & Flexible
- Suitable for startups → large enterprises
-
Pay-as-you-scale model
-
Advanced Threat Detection
Detects: - Malware
- Privilege escalation
- Suspicious processes
Disadvantages:
- High Cost
- Expensive for small organizations
-
Pricing increases with number of assets
-
Complex Setup & Learning Curve
- Initial configuration can be confusing
-
Requires knowledge of:
- Cloud platforms
- IAM roles
- Security policies
-
Dependency on Cloud Access
- SaaS model requires internet access
-
Limited offline capability
-
Alert Overload (False Positives)
- Generates many alerts initially
-
Requires tuning to reduce noise
-
Integration Complexity
- Integrating with existing tools may require effort
-
CI/CD integration needs proper configuration
-
Defender Management Overhead
Agents (Defenders) need: - Updates
- Monitoring
Adds operational effort
ISSUES & TROUBLESHOOTING
Issues Faced:
- Defender Not Connecting to Console
- Defender agent fails to register with Console
-
Status shows Disconnected / Unhealthy
-
Console Not Accessible
- Unable to open Prisma Cloud Console UI
-
Browser shows timeout or connection refused
-
Login / Authentication Problems
- Invalid credentials
- SSO login failure
-
Session timeout issues
-
Cloud Account Onboarding Failure
- AWS / Azure / GCP integration not working
-
Resources not discovered
-
Vulnerability Scan Not Showing Results
- No CVEs detected even after deployment
-
Empty dashboard
-
Excessive Alerts (Noise)
- Too many alerts generated
-
Difficult to identify real threats
-
Defender Deployment Issues
- Container/agent fails to start
-
Crashes after deployment
-
Network Connectivity Issues
- Console and Defender cannot communicate
- Firewall or proxy blocking traffic
Common Errors:
There some common errors to specify the issues and troubleshooting. Some of the common issues are listed below this:
- Connection Error
- Authentication Error
- Defender Error
- Permission Error
- Scan Error
SECURITY & COMPLIANCE
These are the security features of palo alto networks:
Data Handling:
Data Encryption:
- Data is encrypted:
- In transit (TLS/HTTPS)
- At rest (cloud storage encryption)
Access Control:
- Role-Based Access Control (RBAC)
- Only authorized users can access sensitive data
Data Minimization:
- Collects only required metadata (not full payloads in many cases)
- Reduces exposure risk
Secure APIs:
- Uses authenticated APIs for communication
- Prevents unauthorized access
Multi-Tenant Isolation:
- Each customer environment is logically isolated
- Ensures no data leakage between tenants
Log Storage:
Centralized Logging:
- All logs stored in Prisma Cloud platform
- Includes:
- Audit logs
- Activity logs
- Threat logs
Types of Logs:
- 🔹 Audit Logs → User activities (login, changes)
- 🔹 Event Logs → Alerts and incidents
- 🔹 Compliance Logs → Policy violations
Log Retention:
- Configurable retention period
- Depends on subscription plan
Integration:
- Logs can be exported to:
- SIEM tools (e.g., Splunk)
- External storage systems
Security of Logs:
- Logs are encrypted
- Tamper-resistant storage
Compliance Support:
Prisma Cloud supports multiple industry standards:
Common Compliance Frameworks:
- CIS (Center for Internet Security)
- PCI-DSS (Payment Card Industry)
- HIPAA (Healthcare Security)
- ISO 27001
- GDPR (Data Protection Regulation)
Compliance Features:
- Continuous compliance monitoring
- Automated policy checks
- Real-time alerts for violations
- Pre-built compliance templates
Reporting:
The report of the palo alto networks contains like:
- Generates:
- Audit-ready reports
- Compliance scorecards
- Helps in:
- Internal audits
- External regulatory audits
Policy Enforcement:
- Automatically enforces security rules
- Prevents non-compliant configurations
SCALABILITY & PERFORMANCE
Can it Scale?
- Highly scalable (cloud-native architecture)
- Designed to handle:
- Thousands of cloud assets
- Multi-cloud environments (AWS, Azure, GCP)
- Auto-scales based on:
- Workloads
- Data volume
- Since it is SaaS, scaling is managed by Palo Alto Networks
Performance Observations:
Agentless (CSPM):
- No performance impact on workloads
- Fast scanning of cloud configurations
Agent-based (Defender):
- Lightweight agent
- Minimal CPU & memory usage
- Real-time monitoring without major slowdown
Dashboard Performance:
- Real-time updates
- Handles large data efficiently
Scanning Performance:
- Fast vulnerability scans
- Continuous monitoring without manual triggers
Enterprise Readiness:
- Suitable for large-scale enterprises
- Supports:
- Multi-cloud environments
- Hybrid deployments
Enterprise features:
- Role-Based Access Control (RBAC)
- API integrations
- SIEM integration
- Compliance automation
Its widely used in industries like banking, healthcare, and IT.
DEPLOYMENT SOP
Requirement Checklist
The checklist contains some elements;
Before deployment:
- Cloud accounts (AWS / Azure / GCP)
- IAM roles / permissions ready
- Network access (ports, firewall rules)
- Admin credentials
- Subscription/license activated
- Infrastructure (for Defender if needed)
2. Architecture Selection
Choose based on company needs:
SaaS Model (Recommended):
- Prisma Cloud hosted by Palo Alto
- Best for most organizations
Compute (Self-Hosted):
- Console + Defender deployed locally
- Used for:
- Air-gapped environments
- On-prem setups
Installation Steps
The installation setup is based on the type of computer and the setup is used in it:
SaaS (Typical Setup):
- Access Prisma Cloud console
- Create tenant
- Login to dashboard
Compute (Lab/On-Prem):
- Install Console (Docker/Kubernetes)
- Deploy Defender agents
- Verify connectivity
4. Configuration Steps
- Onboard cloud accounts
- Configure IAM roles
- Enable CSPM scanning
- Deploy Defender (for runtime protection)
Configure policies:
- Vulnerability rules
- Runtime protection
- Set alert thresholds
5. Validation Checklist
After the setup the checklist require some elements like:
- Cloud accounts connected
- Defender status = healthy
- Vulnerability scans running
- Alerts generated correctly
- Dashboard showing data
6. Reporting Setup
- Enable:
- Compliance reports
- Vulnerability reports
- Schedule automated reports
Integrate with:
- SIEM tools (Splunk, etc.)
Configure alert notifications:
- Email / Slack
7. Client Handover Process
Provide:
The following information should be provided to ensure proper access and understanding of the system.
- Admin credentials: Admin credentials must be provided to allow authorized access to the system.
- Documentation: Proper documentation should be shared to guide users in setup and usage.
Explain:
Key functionalities should be clearly explained to users.
- Dashboard usage: Users should be guided on how to use the dashboard for monitoring and management.
- Alert handling: The process of handling and responding to alerts should be explained in detail.
Deliver:
Essential deliverables should be provided for reference and implementation.
- Architecture diagram: An architecture diagram should be delivered to show the system structure.
- Configuration details: Detailed configuration information should be provided for setup and maintenance.